Two Big Ideas
The idea of correlation has been around for a very long time. To understand correlation, we really need to grasp just two ideas. The first is simply this: as one thing increases in size or value, so does another thing. If they increase at approximately the same rate, they are said to co-vary. Here's the second big idea: just because two things vary in the same way doesn't necessarily mean that one thing causes the other. People who work with statistics therefore get the t-shirt to remind them that "correlation does not mean causation". The example I'm going to give you first comes from one of my favourite books on methodology in the social sciences. In fact, we could even claim it was the first book on methodology in the social sciences! It was written by Adolphe Quetelet in 1835 (first English edition in 1845), and still has a profound impact on our lives today. The book was entitled A Treatise on Man, and was the very first attempt "measure man" by collecting statistics on everything from births, deaths, income, size and weight, to intellectual ability. It was the first attempt to produce what Babbage (published 1857, but written in 1832) had described as a publication that would "...contain all those facts which can be expressed by numbers in the various sciences and arts" (ibid., p. 289), including man. I'm lucky enough to have a first English edition of Quetelet's work, and below I've made a scan of a table that occurs on page 64. This table charts the size (height) and weight of men and women in meters and kilograms at different ages.
What you will immediately observe from this chart is that as we get older we grow taller, and our weight increases. However, man "begins to waste in a sensible manner about the age of 60". Age, height and weight correlate. Quetelet then looks at the ratio of weight to size (height) and comes to the following conclusion:
"In general, we do not err much when we assume that, during development, the squares of the weight at different ages are as the fifth powers of the height; which leads to this conclusion in supposing the specific gravity constant, that the transverse growth of man is less than the vertical.
However, if we compare two individuals who are fully developed and well-formed with each other, to ascertain the relations existing between the weight and stature, we shall find that the weight of developed persons, of different heights, is nearly as the square of the stature."
(Quetelet, 1834/45, p. 66. Italics in the original)
You will notice the use of the word "constant" - which is of course taken from the laws of natural science. What Quetelet (and Babbage) were trying to do was find the natural constants that governed mankind. They found this in the notion of correlation - even if the term and the statistics to calculate it were yet to be invented. Quetelet's theoretical construction is well known to us today: "l'homme moyen" - or the "average man".
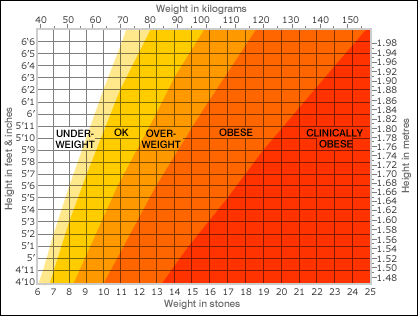
And how does this affect us today? Any of you who like me have a regular medical check-up will have your height measured, and you will stand on a weighing scale. Your height and weight will then be read off against the Body Mass Index (BMI) which tells you whether you are within the ratio established by Quetelet. So correlation underpins the decision about whether we are overweight or not. You can try this out for yourselves. Go to the National Health Service BMI Healthy Weight Calculator. Enter your height, weight, and how much activity you take. You'll get back a result that tells you if your weight falls outside the range expected for your age and height. It also tells you how many calories you should have per day in order to lose weight if it decides you are....well...."fat".
But notice that while age, height and weight, are correlated, there is no causation, other than the fact that as we tend to get older we grow. What we eat has more causal effect on weight once we reach a stable height. But we understand causal effect through our ability to create scientific hypotheses and test them, not through correlation.
An Illustration of Correlation without Causation To understand this, let's look at a piece of real correlational research that has no causal explanation. In 2010 a mathematician called Matt Parker collected two sets of data by English counties: the number of mobile phone masts, and the number of births. He found a very high correlation. He put out this press release announcing the finding that for each single additional mobile mast built in a particular area, the number of births increases by 17.6 babies. Perhaps the radiation from the masts leads to an increase in fertility? Or perhaps the story was just a hoax?
Listen to Matt Parker explain the second big idea of correlation, that no causation is implied, from an interview on the radio programme More or Less.
One of the most important things to take away from this short audio clip is another big idea: humans like to find patterns in data, and the way we like to make sense of patterns is through the concept of causality. As Hume (1748, IV I 27) puts it, knowledge "...arises entirely from experience, when we find that any particular objects are constantly conjoined with each other." But Hume was the originator of the problem of induction: we cannot find causality or "constants" in our experience of things being "constantly conjoined" or correlated. All our attempts to infer causality are essentially risky!
Risk and Uncertainty
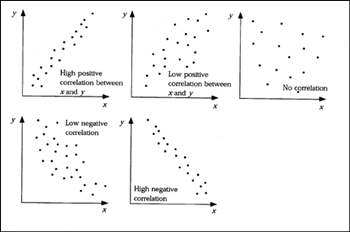
The idea of the correlation coefficient began with the work of Frances Galton on heredity. But it was Karl Pearson (pictured right), who went on to formulate the correlation coefficient as we have it today (see Stigler (1986), p. 342ff). This is why the most widely used correlation coefficient is termed the PPM, or Pearson Product Moment correlation. The formula gives us a correlation (usually symbolised as "r") between -1 through 0 to +1.
When the data points for each observation is plotted against two variables, we get the now familiar scatter plots on the left. A high positive correlation approaches +1 and a high negative correlation approaches -1. Little correlation is close to 0. But it's not just a matter of not being able to establish causality. We have long known that in the social sciences any sets of measurements that are reasonably reliable will correlate with any other set of reasonably reliable measurements, even if they are totally unrelated. Meehl (1990) refers to this as the "crud factor". We are going to find medium correlations everywhere, and if we have enough participants in our study (the n-size), we will find statistically significant correlations. They may be "statistically" significant, but they will not be theoretically significant. The problem with humans is that they want to treat the two kinds of significance in the same way. Here's how Meehl put it:
"In the social sciences and arguably in the biological sciences, "everything correlates to some extent with everything else." This [is a] truism, which I have found no competent psychologist disputes given five minutes reflection....There is nothing mysterious about the fact that in psychology and sociology everything correlates with everything. Any measured trait or attribute is some function of a list of partly known and mostly unknown causal factors in the genes and life history of the individual, and both genetic and environmental factors are known from tons of empirical research to be themselves correlated."
Lykken (1968) was a little more polite. He referred to the crud factor as the "ambient correlational noise" of the Universe that the social scientist inhabits. He concluded that correlation in and of itself was no sufficient to arrive at any conclusion about theory in social or psychological research. What is needed is replication, primarily concerned with testing the hypotheses generated by theory:
"In the social, clinical, and personality areas
especially, we must expect that the size of the
correlations, differences, or effects which
might reasonably be predicted from our theories
will typically not be very large relative
to the ambient noise level of correlations and
effects due solely to the "all-of-a-pieceness of
things." The conclusion seems inescapable that
the only really satisfactory solution to the
problem of corroborating such theories is that
of multiple corroboration, the derivation and
testing of a number of separate, quasi-independent
predictions."
This gives us another big idea. Everything is related to everything else, and given a large enough n-size, we'll pick up the underlying noise as significant. That means we could start to believe our theories are true on the basis of moderate correlations that we should have expected to find all along. Whenever you see a correlation reported in research, or in news items, always ask what it is likely to mean given the entire context, n-size, and whether the researchers have an investment in particular interpretations.
Correlation in Everyday Life
In particular, we should always be sceptical about claims that rely on correlational evidence rather than scientific experimental trials. I'm the first to admit that the best for us is everything in moderation. But if we were to take seriously every single medical story related to food and drink in the news, we'd simply die of starvation. We've had eggs and heart disease, wine and dementia. Well of course, if I eat or drink more than a reasonable amount, anything will do me harm. The most recent of these claims is that eating red meat is associated with bowel cancer. But it's almost all correlational. And we have to remember that in large populations, we will discover correlations between all kinds of things. So we need to get beyond the news story, and look at the critical evaluations of the research.
The following video that I've linked in from YouTube is a fun illustration of the kind of thing we're talking about. From the PsychFiles, it illustrates the problems with interpreting correlations of all kinds. The sound is a little iffy in places, but it was designed to sound like a real news show with "experts" phoning in to give their take on the items
So the message is clear. In social science research, most things correlate with each other. Correlation must therefore be interpreted with care, and cannot on its own support a causal theory.
One of the best ways to explore this is by visiting the Spurious Correlation Website, run by Tyler Vigen. The purpose of the website is to collect large data sets on a range of completely unrelated variables and correlate them. The fun part is to try to concoct a theory that could account for the association indicated by the correlation. There are lots of spurious correlations on the home page, but notice at the top there is a link entitled discover a new correlation. Here you can select variables that you are interested in. Try this one: select "interesting causes of death" and then click on "view variables". I selected the one at the top of the list - "drownings caused by an accident involving a fishing boat." Next, press "correlate" and select a variable with which to correlate the deaths by fishing boat accident. I selected the divorce rates in Washington D.C. You will discover that r = .59 (rounded to two decimal places). That's quite a lot higher than the correlations used to develop theories in social science. So what theory can explain this correlation? A fisherman-specific kind of depression related to separation?
Here's Tyler Vigen talking to Tim Harford about his website, and the range of spurious correlations that can be generated. And yes - there is another warning about causation in here! This is a very amusing audio clip!
Online Correlation Tools
Yes, there are lots of online calculators to get your Pearson Product Moment Correlation. Try out some of these links. You may like to put in data from Quetelet's table (above).
Validating Automated Speaking Tests
There is a growing literature related to the validation of automated language tests, where a computer algorithm assigns the score to a sample of either written or spoken language. The scores from the automated system are correlated with those awarded by trained human raters. The correlation between the two is cited as validation evidence. Thus, from the abstract of Bernstein et al. (2010) we get claims such as
"...the automated tests predict scores from the live interview tests as well as those tests predict themselves in a test-retest protocol (r = 0.77 to 0.92). Although it might be assumed that the interactive nature of the oral interview elicits performances that manifest a distinct construct, the closeness of the results suggests that the constructs underlying the two approaches to oral assessment have a stable relationship across languages."
The essential argument in this research is that underlying the ability to speak a second language are a set of psychological constructs, or "facilities", that are separate from the context of communication. They are therefore "enablers" that are essential for successful communication, and therefore correlated to assessments of that communication. There is a second leap here. If there is a correlation between the facility score and a test score, as the facility underlies all spoken communication, the facility score must also be predictive of spoken communicative ability in non-test contexts beyond those modelled in any specific test of speaking. The item types that measure this "speech facility" include: reading sentences loud, repeating sentences, providing antonyms, sentence building from phrases provided, short answers to questions, and retelling spoken text. Of critical importance, therefore, is the definition of "facility". This is provided on p. 358:
Facility can be defined as the ability to understand the spoken language on everyday topics and to speak appropriately in response at a native-like conversational pace in an intelligible form of the language. 'Appropriate' in this context means the response is one of the likely forms observed from natives and/or high-proficiency non-natives that also is judged 'correct' by experts.
The responses to each item are scored according to four criteria - pronunciation (matched against a database of acceptable pronunciation), fluency (speed of delivery, lack of pauses, etc. based on native-speaker norms), sentence accuracy, and selection of appropriate vocabulary. The aggregated and weighted scores are then correlated with human scores. The paper presents the correlations and sets of scatterplots in a way that is typical of research papers that rely on primarily correlational evidence.
The authors are aware of four criticisms of this approach, which I list here with their rebuttals:
The facility test does not specify a domain to which scores refer, and for which decisions are to be made. Rebuttal: there is no evidence to show that domain specific tests are better predictors of domain specific performance.
Facility tasks lack the contextual and content complexity of the target domain. Rebuttal: facility tasks embody "core" lingistic skills without which contextual performance would not be possible
Responses to facility tasks are too short and simple to represent the complex speaking construct. Rebuttal: standard error of measurement is low, and scores are correlated with humans up to higher intermediate levels on rating scales
The test may have negative washback on teaching. Rebuttal: There is no evidence to suggest that this is the case.
So what is the problem? The first is the mantra that correlation is not causation. Correlations cannot show that what these tasks require language learners to do are causally related to real-world speaking performance. Indeed, linking responses to native-speaker models, and to surface phenomena such as delivery speed or pause length, is to either misrepresent, or under-represent, the construct (Fulcher, 2015, chapter 5). If everything is related to everything (fishing accidents and divorces in DC at .59) then language related phenomena are likely to correlate more highly, especially if the instruments have been designed, and raters trained, with high correlation in mind. To this extent, our results in social science research are not independent of our instruments. There is a contingency at play here. It is therefore not enough to say that domain specific tests may not be better predictors of domain specific performance than facility tests. This commits what Kaulfers (1944, p. 138) has called the "correlational fallacy". There must be some content and domain relevance to the content, if there is to be a reasonable expectation that the score can be related to the target domain. Here is what Kaulfer's says on the matter:
"The tests must not be guilty of the 'correlation fallacy', the common delusion that a
certain level of ability on a pencil-and-paper test of vocabulary, grammar, or reading
comprehension can automatically be interpreted to mean a corresponding level of
ability to understand the spoken language, or to speak the language fluently."
and...
The nature of the individual test items should be such as to provide
specific, recognizable evidence of the examinee's readiness to perform in a
life-situation, where lack of ability to understand and speak extemporaneously
might be a serious handicap to safety and comfort, or to the effective
execution of military responsibilities.
The evidence we need is not a correlation with human raters, but predictive evidence for the criterion real-world performance. This inevitably includes prediction of the complexity of what is required in the target domain. For Kaulfers, this meant not sending soldiers into dangerous situations when there was any possibility that their language abilities would not be adequate to the tasks asked of them. The argument from correlation therefore commits a double fallacy, and the rebuttals are ineffective to the main thrust of the criticism.
References
Babbage, C. (1857). On Tables of the Constants of Nature and Art. Annual Report of the Board of Regents of the Smithsonian Institution (pp. 289 - 302). Washington DC: Cornelius Wendell.
 Two Big Ideas
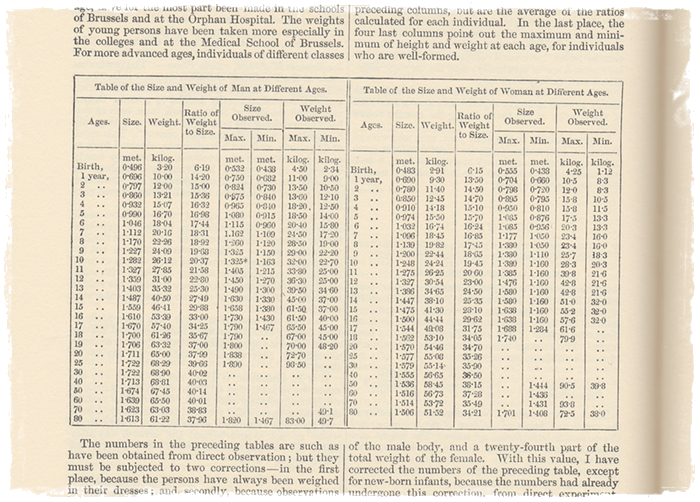

 When the data points for each observation is plotted against two variables, we get the now familiar scatter plots on the left. A high positive correlation approaches +1 and a high negative correlation approaches -1. Little correlation is close to 0. But it's not just a matter of not being able to establish causality. We have long known that in the social sciences any sets of measurements that are reasonably reliable will correlate with any other set of reasonably reliable measurements, even if they are totally unrelated. Meehl (1990) refers to this as the "crud factor". We are going to find medium correlations everywhere, and if we have enough participants in our study (the n-size), we will find statistically significant correlations. They may be "statistically" significant, but they will not be theoretically significant. The problem with humans is that they want to treat the two kinds of significance in the same way. Here's how Meehl put it:
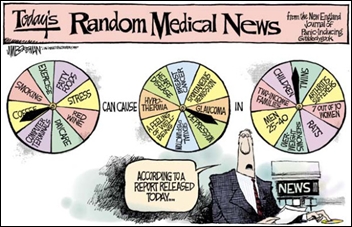 Correlation in Everyday Life
 References